Track your LinkedIn performance with powerful metrics
Get comprehensive insights into your LinkedIn activity, audience engagement, and content performance to optimize your strategy.
Why track your LinkedIn metrics?
Make data-driven decisions to optimize your LinkedIn strategy
Measure Performance
Track key metrics like impressions, engagement, and follower growth to understand what's working and what's not.
Optimize Content
Identify your top-performing content types and topics to create more of what resonates with your audience.
Understand Your Audience
Gain insights into your audience demographics, interests, and behavior to better tailor your content strategy.
Powerful analytics features
Everything you need to measure and improve your LinkedIn performance
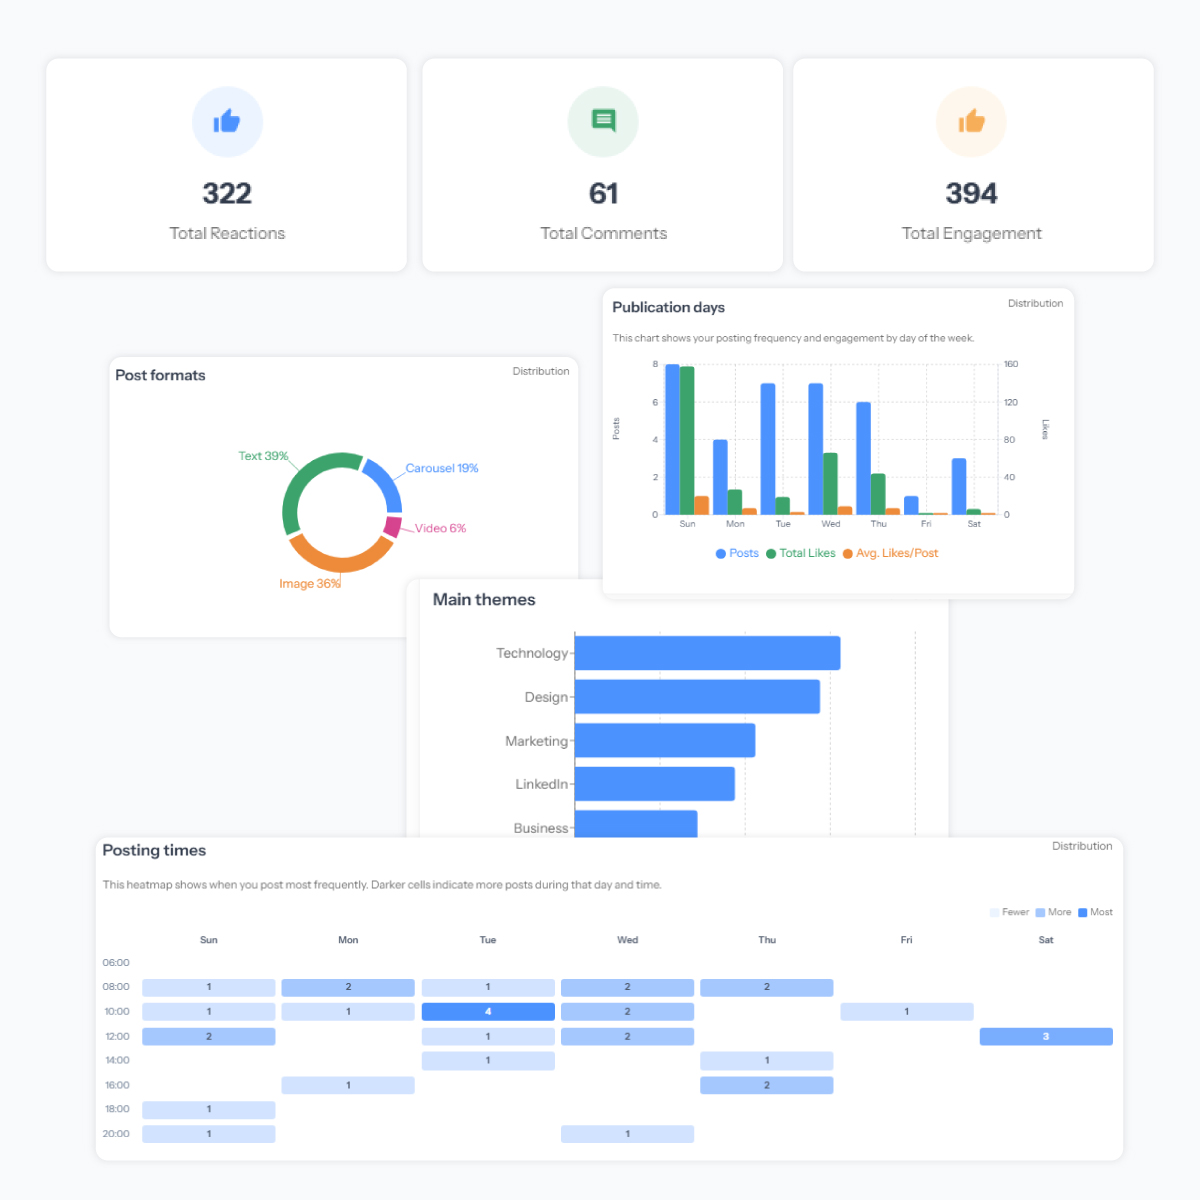
Comprehensive Dashboard
Get a bird's-eye view of all your important LinkedIn metrics in one intuitive dashboard.
Growth Tracking
Monitor your follower growth, connection rate, and profile views over time with detailed charts.
Audience Insights
Understand who's engaging with your content with detailed demographic and behavioral data.
Optimal Posting Times
Discover the best days and times to post based on when your audience is most active and engaged.
Why creators love Instation
Join professionals who've transformed their LinkedIn presence with Instation
Get your Sunday back
Draft a month of content in under 30 minutes using AI that sounds just like you.
Get seen, not scrolled past
Use proven post structures that helped our users get over 100M views - without chasing trends.
Stand out authentically
Create content that reflects your unique voice and expertise, not generic AI-generated posts.
Save hours every week
Turn a single piece of content into multiple engaging LinkedIn posts in minutes.
Frequently asked questions
Everything you need to know about our LinkedIn metrics tools
What metrics does instation track?
Instation tracks all essential LinkedIn metrics including profile views, post impressions, engagement rates, follower growth, content performance, audience demographics, and much more.
How often is the data updated?
Our metrics are updated daily, giving you the most current view of your LinkedIn performance. Historical data is preserved so you can track trends over time.
How does this differ from LinkedIn's native analytics?
While LinkedIn provides basic analytics, our tools offer deeper insights, longer historical data, competitive benchmarking, and actionable recommendations to improve your performance.